Chat interface
The chat interface is accessible via a web browser. By default, the address
is http://0.0.0.0:8099/ - this indicates the website is running from a
the local computer (not on the internet) on port 8099.
The startup screen shows a summary of the data collections incorporated into the crossmap instance. The examples on the screenshots below use an instance that includes collections with gene sets, phenotypes, and disease definitions.

Basic queryies
The interface is organized as a chat. The controller for entering text is at the bottom.

Entering a query and pressing the SEND button (right-hand-side) triggers a request to the crossmap algorithms. The query and the calculation result appear in the chat history.

In the above example, a query with gene symbol ATM was matched with a GO biological process for DNA catabolism. This is a valid result; clicking on the reported identifier opens a page that contains the full definition of that item, which indeed includes the string ATM.
Settings and query types
It is possible to tune queries in several ways. Clicking on the icon with sliders on the left-hand-side of the controller reveals a form with settings regarding the search space and diffusion.
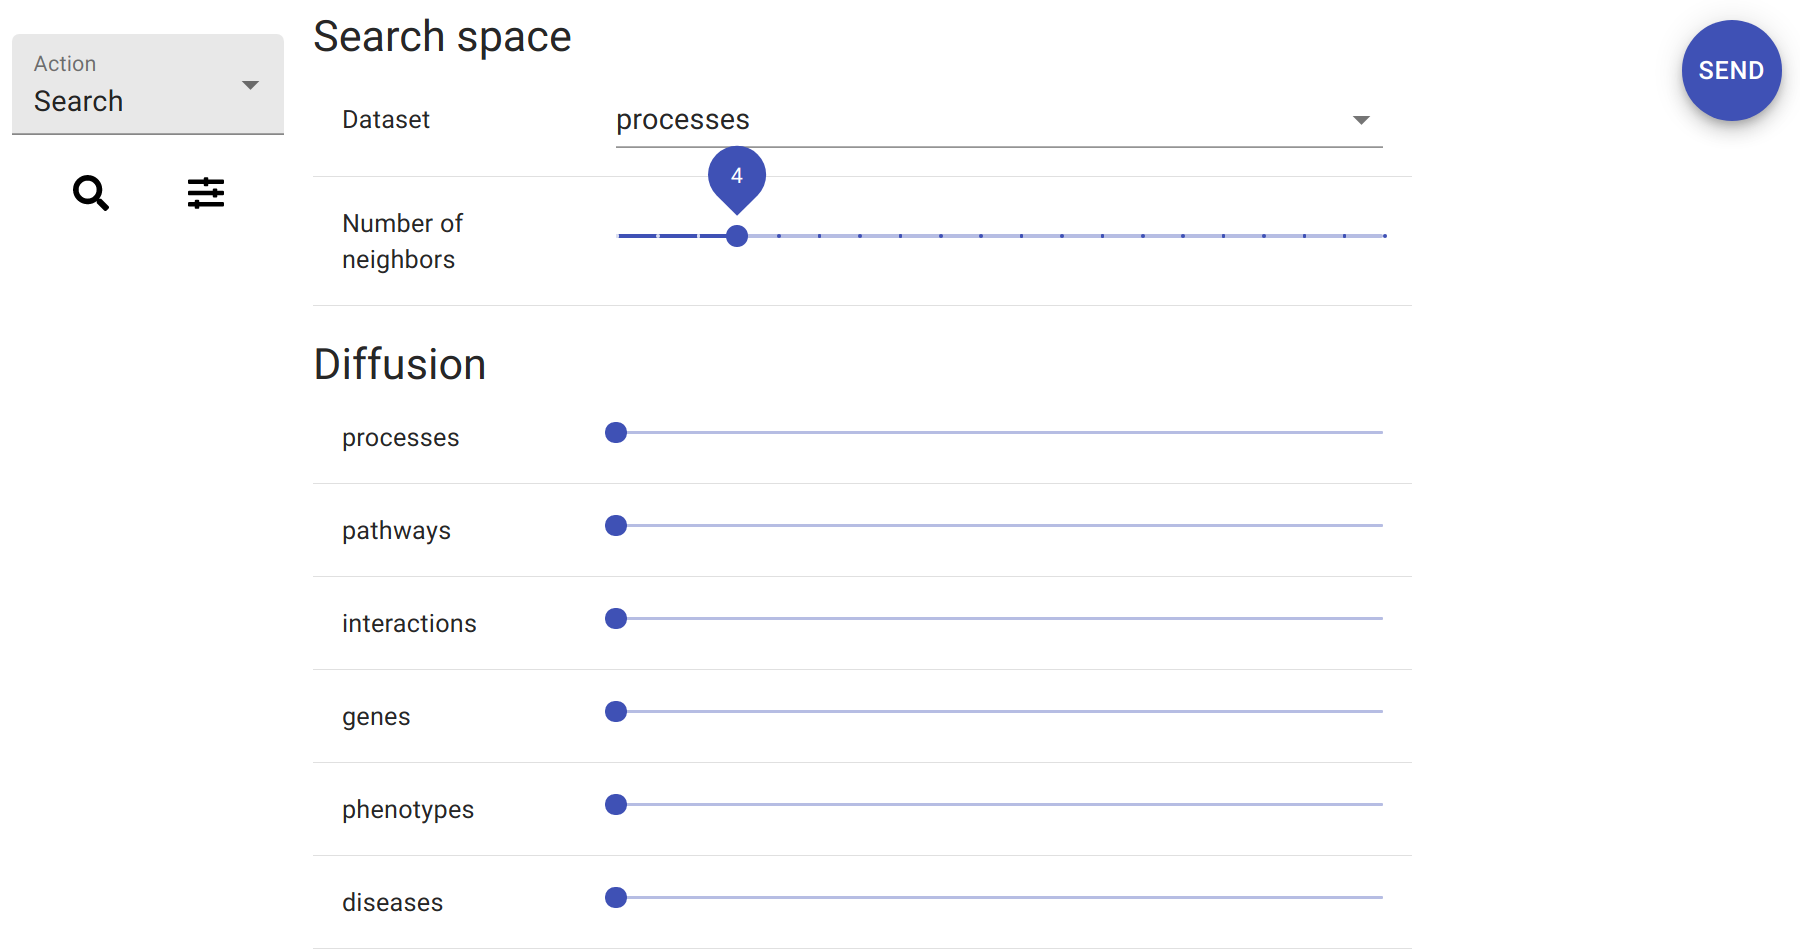
The drop-down box at the top determines the targeted data collection. This defaults to the first dataset listed in the startup message. In this example, the default target dataset is a collection of genesets based on the gene ontology. Changing the target dataset would direct subsequent queries to search in datasets, e.g. with pathway data.
Below the drop-down box is a slider that determines the number of results in the output. The default value is one. However, in practice it is often of interest to look at several of the top results. Examples below use a value of four.
Finally, the last group of controls are sliders that determine diffusion strength. There is one slider for each data collection, as each data collection can be set to drive diffusion with its own settings. By default, diffusion is turned off and all the values are at zero.
Clicking on the search icon (magnifying glass) hides the settings and returns the view to the text areas. Given the adjusted settings, new queries will produce different output. A new search, for example, will produce four outputs.
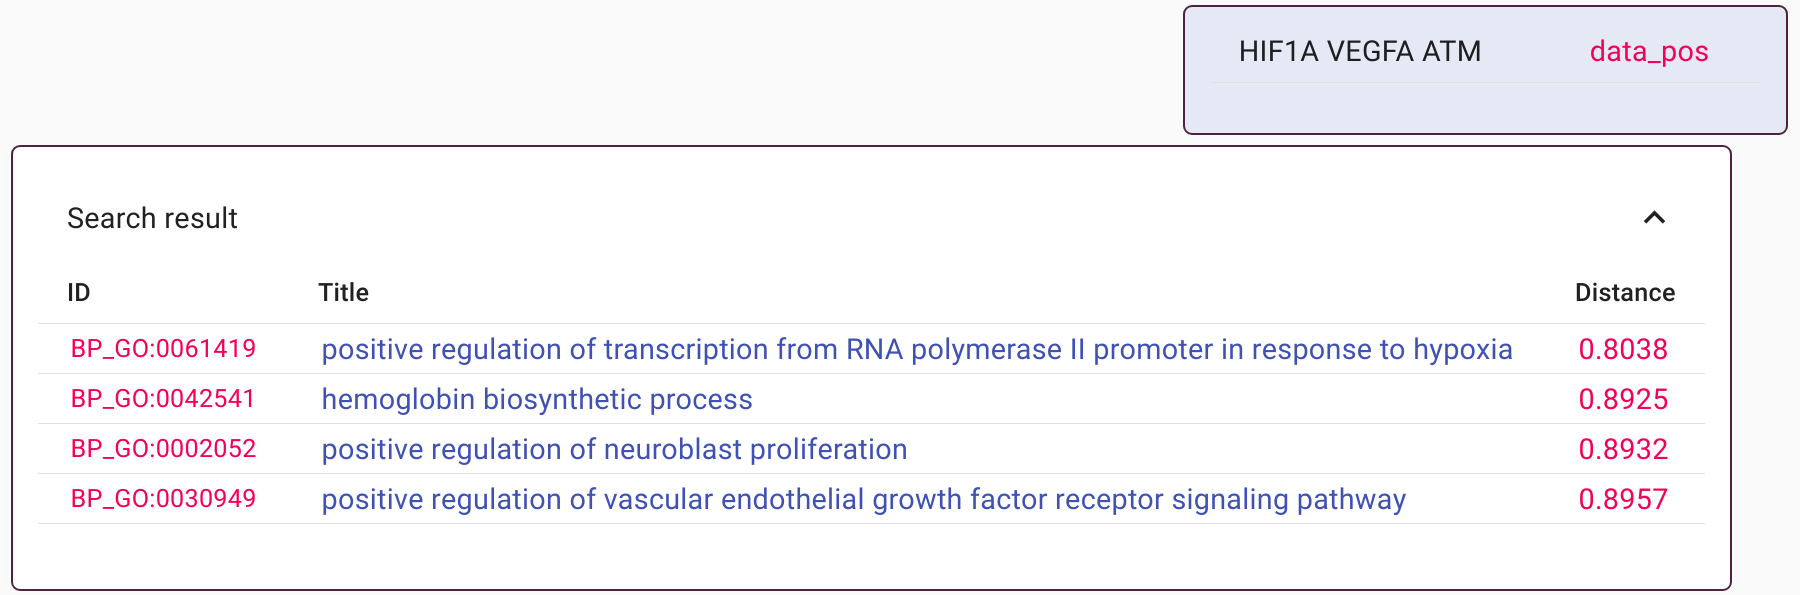
Here, the query is a gene set HIF1A, VEGFA, and ATM. The first two genes participate in oxygen management, and ATM works in pathways related to DNA and damage repair. In the search results, all the outputs are driven by HIF1 and VEGFA and describe partially-overlapping biological processes. This is a natural outcome since those two genes constitute the majority of the query text.
An alternative way to query is via decomposition. Switching between classic search and decomposition is achieved through the drop-down box on the left-hand-side of the controller. Processing the same query as before, this time with decomposition, returns a different set of hits.

The result now contains only two lines. The top hit is, as before, related to oxygen biology and reflects contributions of HIF1A and VEGFA. The second hit, however, pertains to DNA and includes ATM. Thus, the two results provide a concise description of the entire query.
Multi-modal queries
The examples above used gene sets, i.e. the input strings consisted of gene symbols. Crossmap can, however, also process multi-modal queries that mix traditional data types. Crossmap algorithms treat all inputs as plain text and thus it is possible to mix gene symbols with any descriptive terms.

The above example includes the same three genes as before. A previous result showed that the top search results included hits pertaining to hypoxia and hemoglobin. The new search includes string ‘hypoxia’ and ‘hemoglobin’ with negative weight, and this instructs the search to avoid those features. The final outcome is a different ranking that de-emphasizes those terms.
Data diffusion
Data diffusion is a process by which a raw input is augmented with additional features. The algorithm uses co-occurance of features in existing datasets. It distributes the information in an input query to new features in a way similar to how molecules move from a concentrated location to nearby locations that are less concentrated.
Data diffusion can be activated via the sliders in the controller panel. Before actually carrying out queries with diffusion, it is possible to preview the effect of diffusion on any input. This can be achieved by setting the drop-down box on the left-hand-side of the controller to ‘Diffusion’.
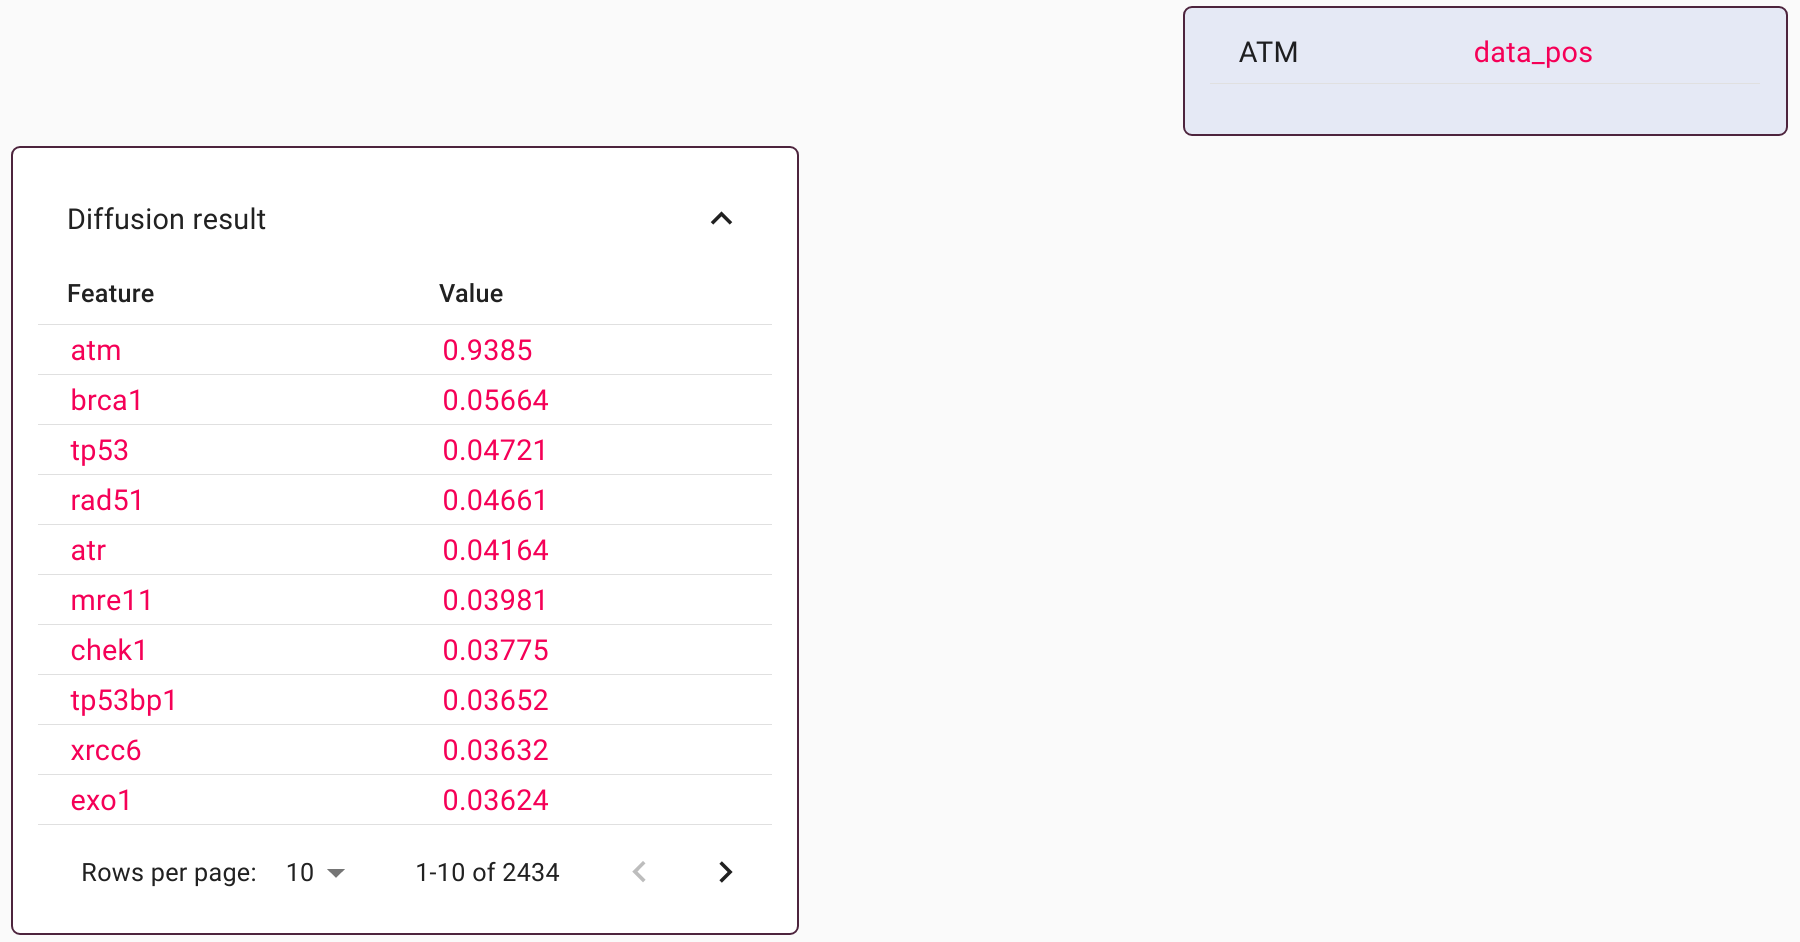
The output above is not a database lookup. Instead, it displays all the imputed features and their relative weights. In this example, diffusion was based on protein-protein interactions. The input string ATM retains a dominant weighting, but there are new features that represent protein interactors. This preview is a means to identify the most common co-occurring features to any given query string.
Diffusion can also be incorporated into search and decomposition tasks. It works seamlessly, with every input query augmented with imputed features before applying a search or decomposition.
Reviewing & Reusing settings
All user queries and responses appear in the chat history. Importantly, each entry also carries a full copy of the technical settings. These settings can be previewed by clicking on a cog icon at the bottom of each chat message (icons appear upon hovering the mouse on the message).
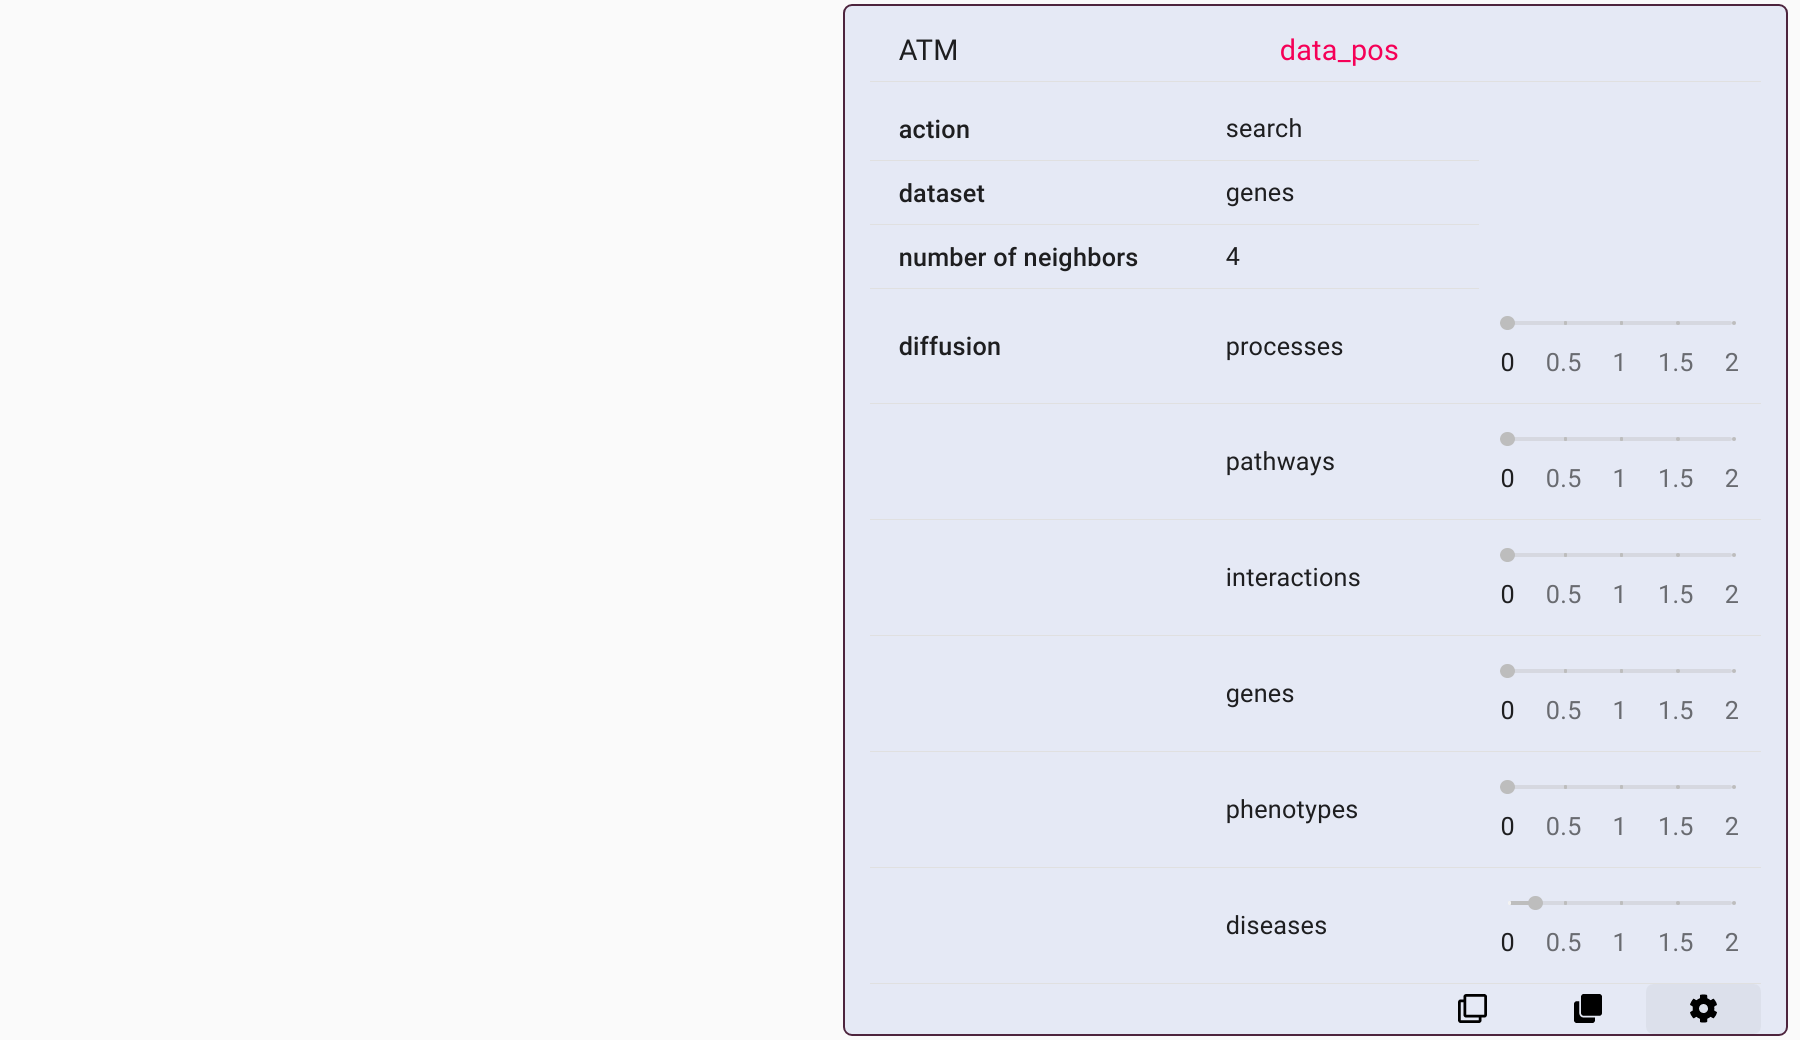
In the example above, the settings reveal that the query string ATM was diffused using the disease collection, and then queried against a collection containing gene phenotypes. (This is a means to find genes that are similar from a phenotypic perspective).
Other buttons near the bottom of each chat message copy the query string or the entire configuration into the controller box at the bottom of the screen. Thus, each calculation recorded in the chat is reproducible.